
Power BI for Dashboards and Key Metrics
Data from CRM, ERP systems, and other sources flows into interactive dashboards and reports. This makes it possible to spot developments earlier and make decisions with greater confidence.
Benefits of Power BI in Everyday Work
Making KPIs Visible
Power BI processes data so that important information becomes easier to understand. Dashboards show how sales, service, marketing, or operational processes are developing.
Features
- Create interactive dashboards
- Visualize KPIs clearly
- Build reports for teams
- Make developments visible
Connecting Data Sources
Data from different systems can be merged. This creates analyses that display tables and reveal correlations.
Features
- Connect Dynamics 365 CE
- Analyze ERP data
- Use Excel and Microsoft 365
- Connect additional data sources
Share Reports
Securely
Reports can be made available specifically for teams, roles, or executives.
This ensures everyone involved gets the information they need for their work.
Features
- Share reports within the team
- Manage access
and roles - Use Power BI on mobile
- Update data regularly
Power BI in Practice
Showcase
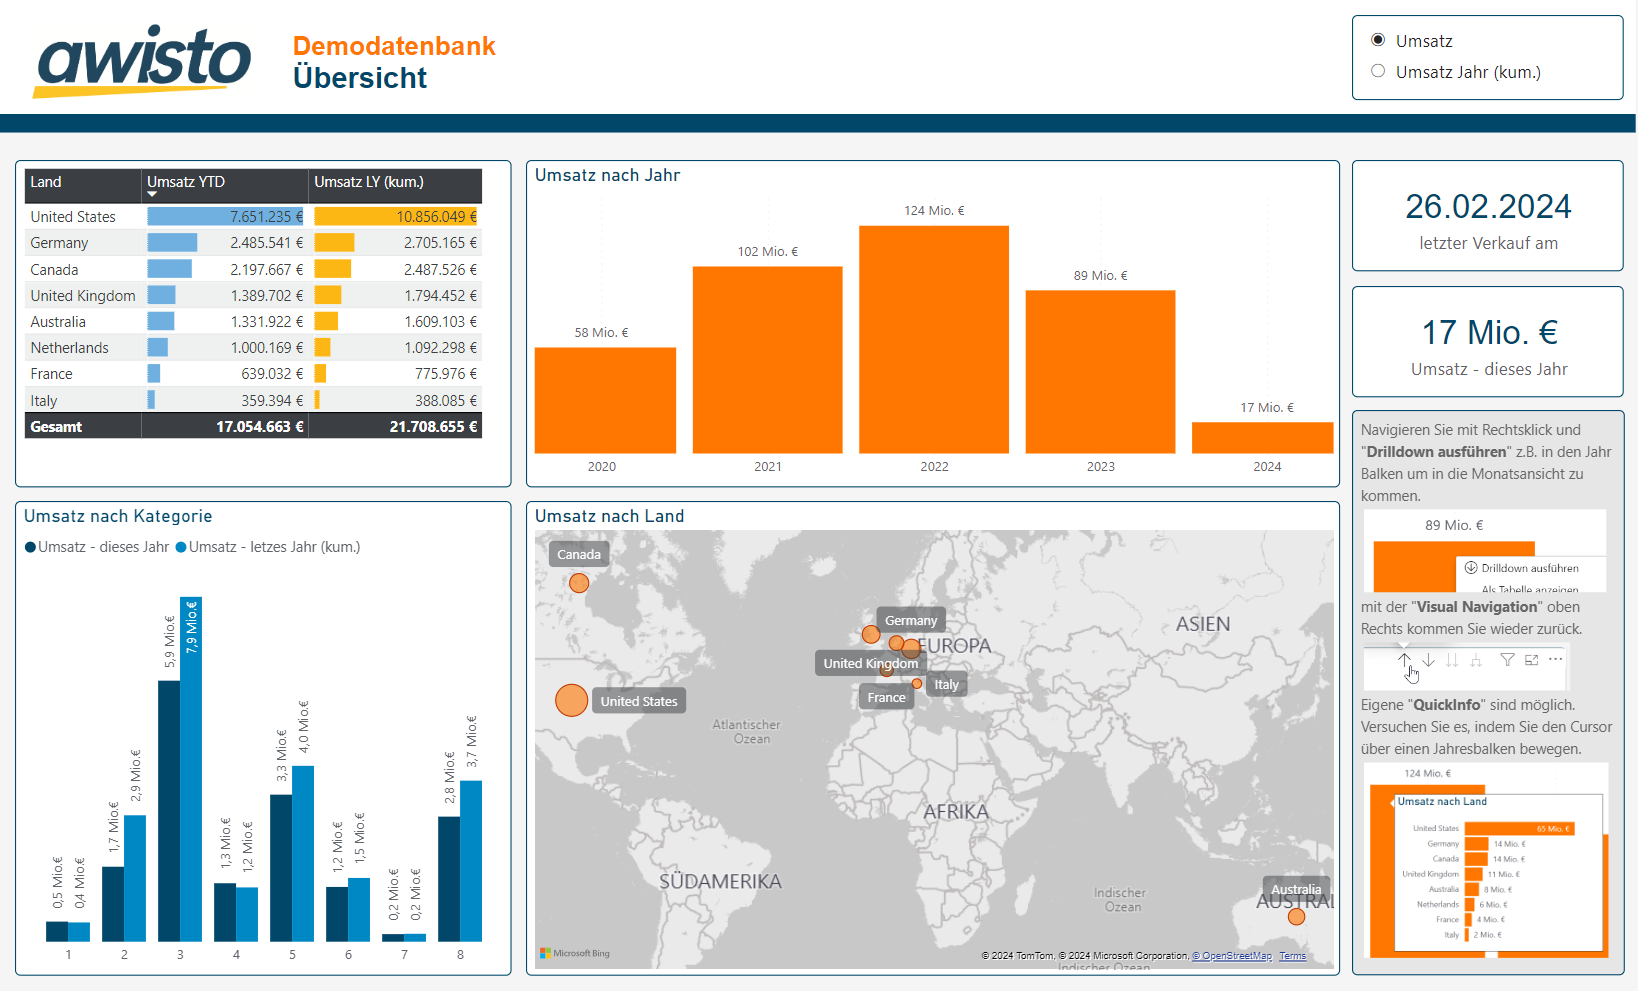
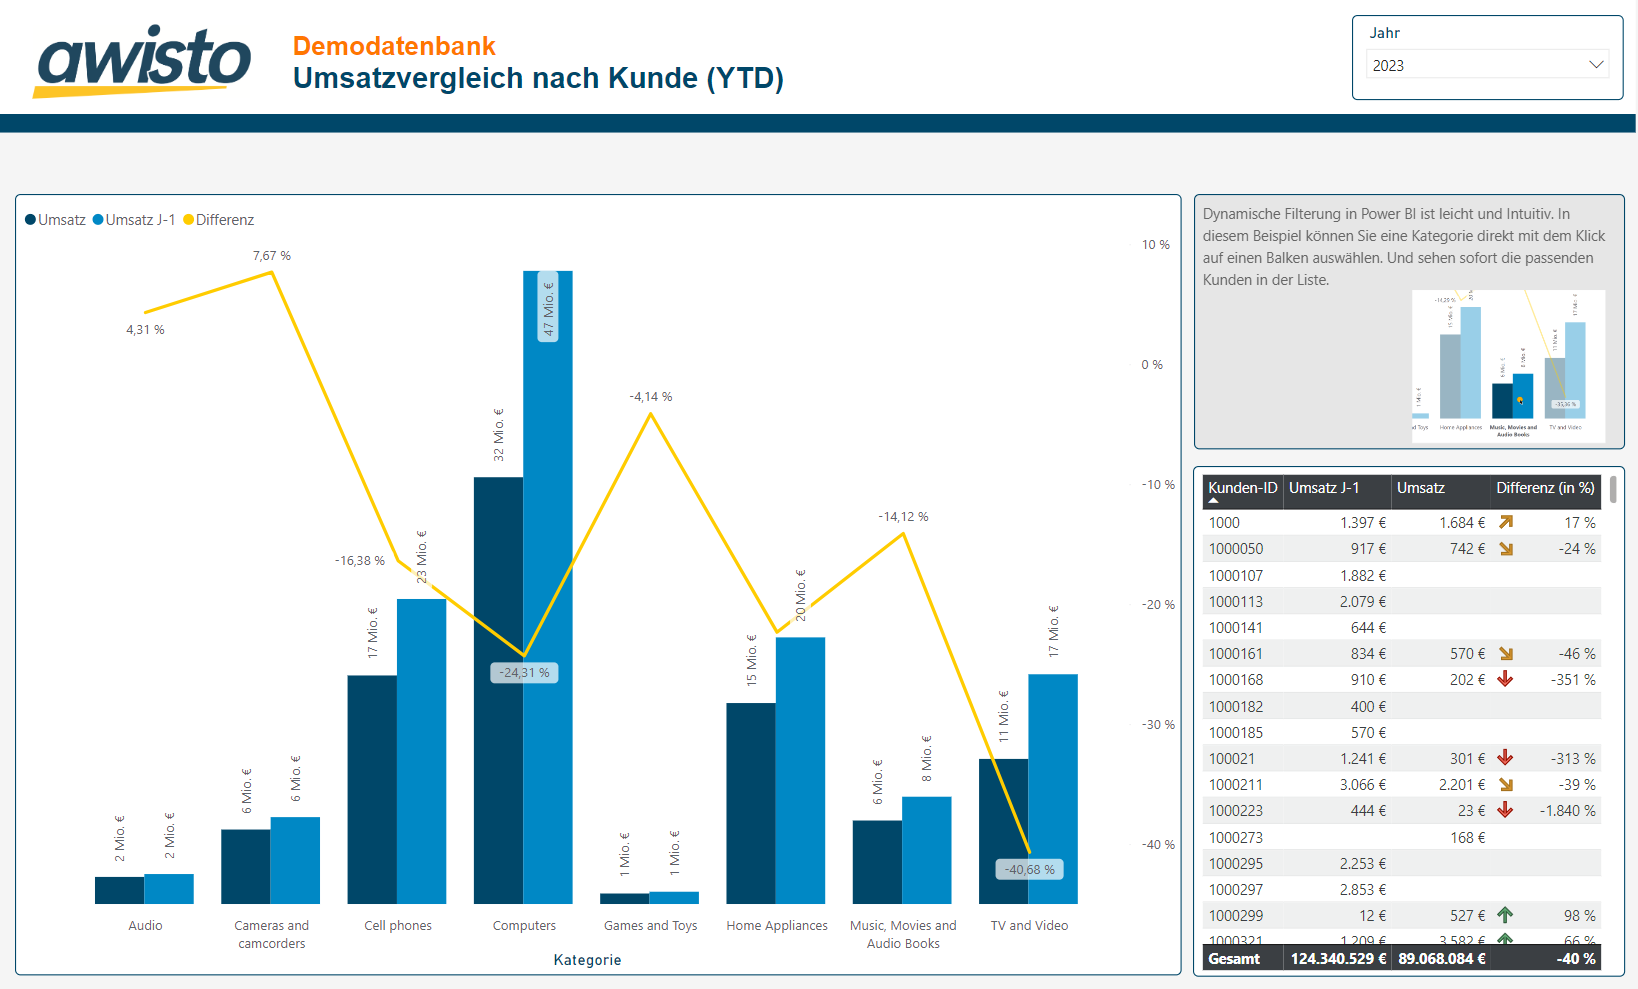
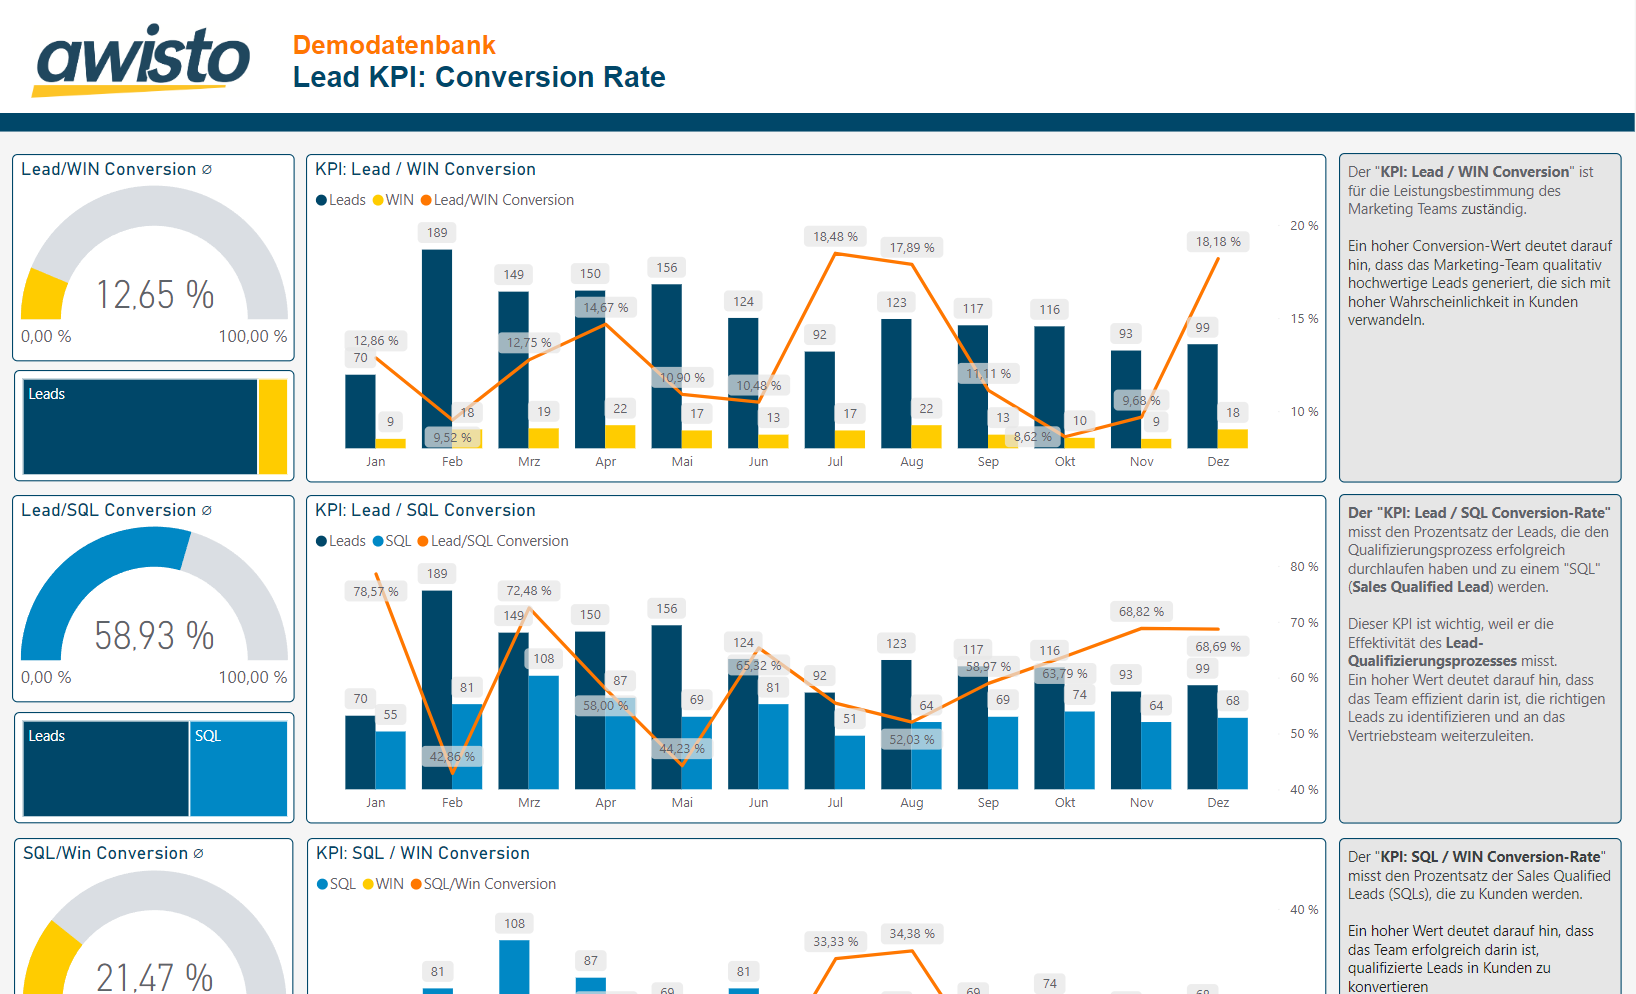
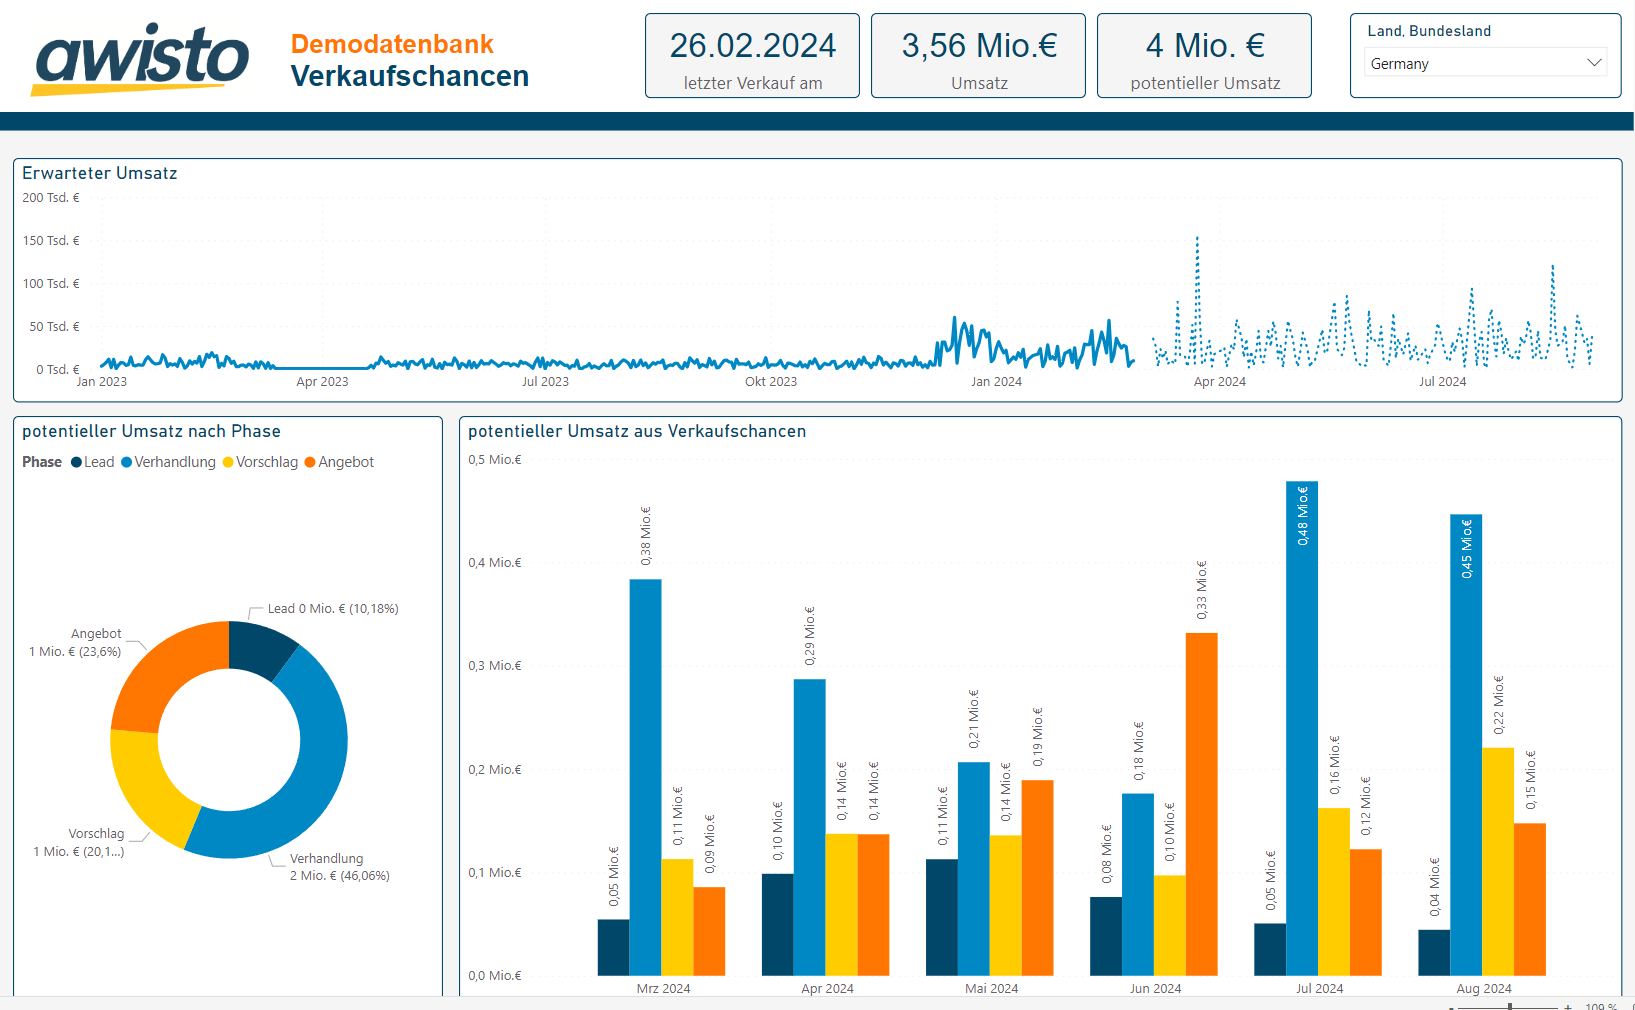
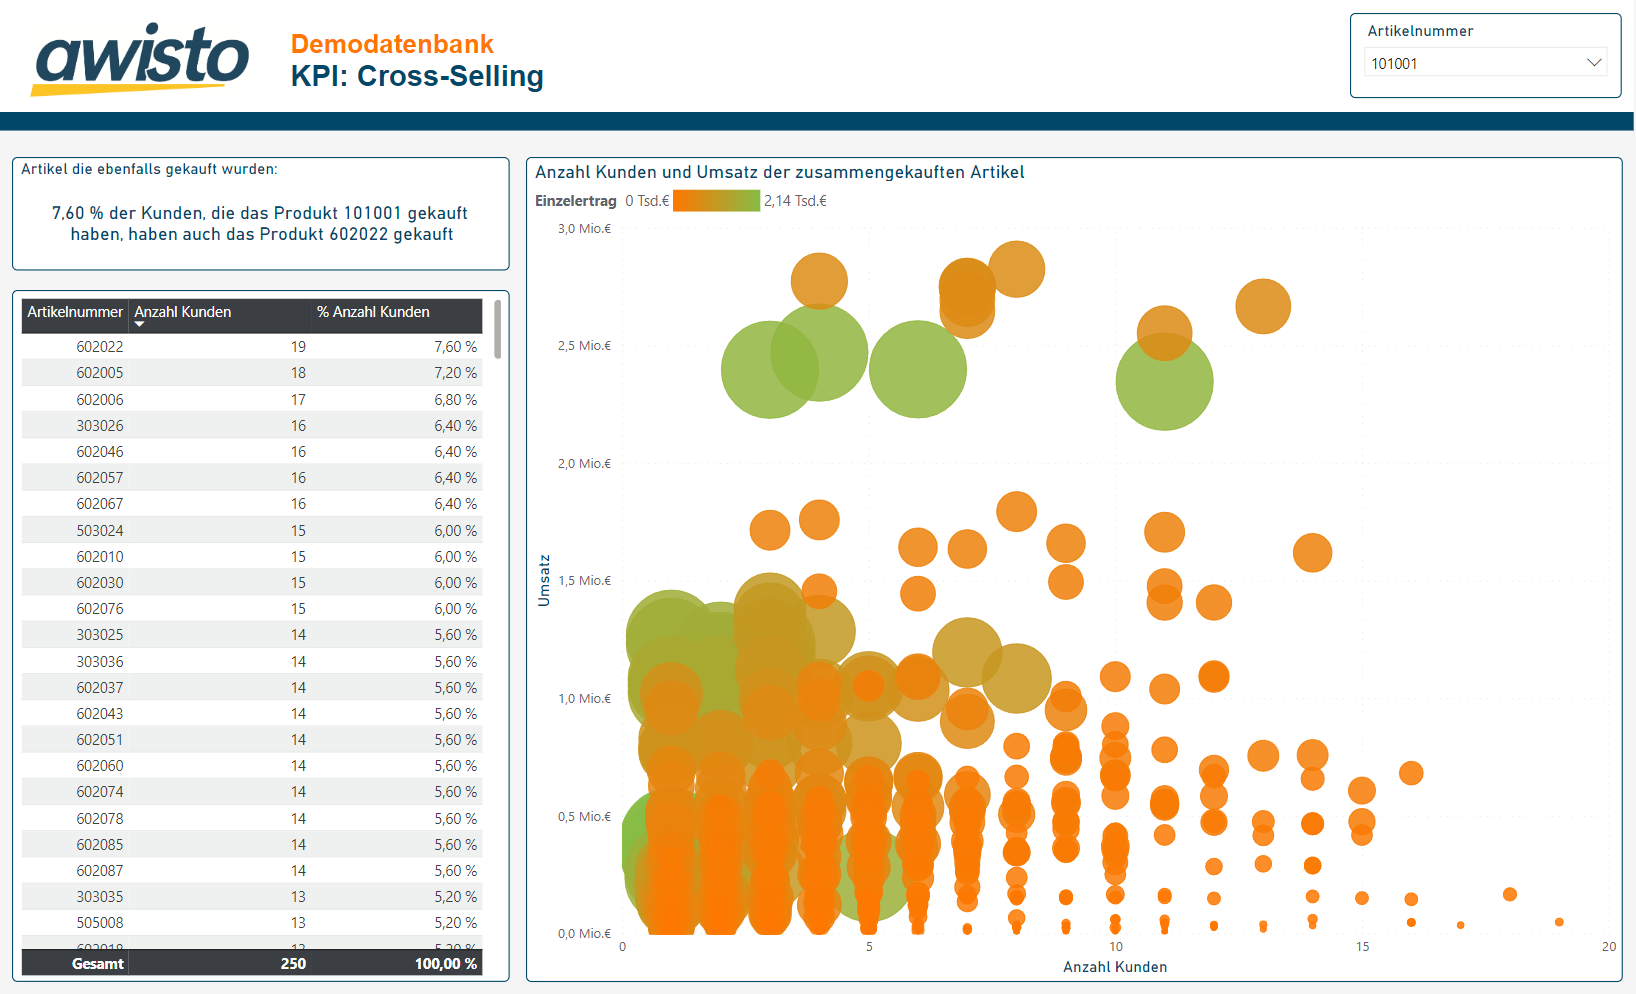
Our interactive showcase demonstrates a sample visualization of sales data based on mock data, featuring drill-down functions, geographic display, and cumulative time comparisons.
Power BI Connecting Seamlessly

Dynamics 365 CE
Analyze data
and KPIs from Dynamics 365 CE in interactive dashboards to gain well-founded insights into developments in sales, service, marketing, and customer management.

Power Apps
Build your own business apps
With Power Apps, you can digitize workflows, forms, and approval processes in custom applications. Data and analyses from Power BI can be integrated directly into your apps.

Power Automate
Fewer clicks for more flow
Power BI reports can be linked with Power Automate to automatically trigger notifications, approvals, or follow-up processes when defined thresholds are reached.
All Your KPIs in View?
With Power BI, your KPIs, developments, and correlations are presented in a clear and understandable way. Talk to us about how data from CRM, ERP, and other systems can be analyzed and put to use across your teams.